Increasing Stakeholder Engagement with Bubbles

Let’s call a spade a spade. Reading long government reports is a little bit like watching paint dry: slow, frustrating and not as colourful.
However, it is an equally frustrating process for the reports’ authors. They’ve spent hundreds of hours gathering data, inputting it into Excel or PDF, only to receive little to no engagement.
That’s why we hosted a webinar to demonstrate how governments, councils and other organisations can significantly increase stakeholder engagement with OrbViz Bubbles. The discussion was joined by Christchurch City Council’s (CCC) Michael Healy and focused on how OrbViz helped CCC to increase their Annual Plan community submissions by 60 percent.
It’s a shared problem
Michael said the Council wasn’t shocked to receive negative feedback from the public on their current reports. The multiple line items laid out in the same monochromic format, with little to no context explaining the rows of data, had left people confused and disengaged.
“The power of Bubbles, is that we can see how many people have seen and read the information, and what specifically they’ve looked at.”
This information was reflected in the webinar poll in which 100% of respondents confirmed they were aware that their information wasn’t in an accessible format. Interestingly, 84% of those same respondents also stated that it was “extremely important” that the information they provided to their communities was correctly understood.
What does this tell us? Well, it shows that there is a large communication chasm between Council and community. This problem has consequences for both parties- councils need to communicate to the community what they are doing to support them, and communities need to understand Council’s budgets and proposed plans.
Everything’s better with Bubbles
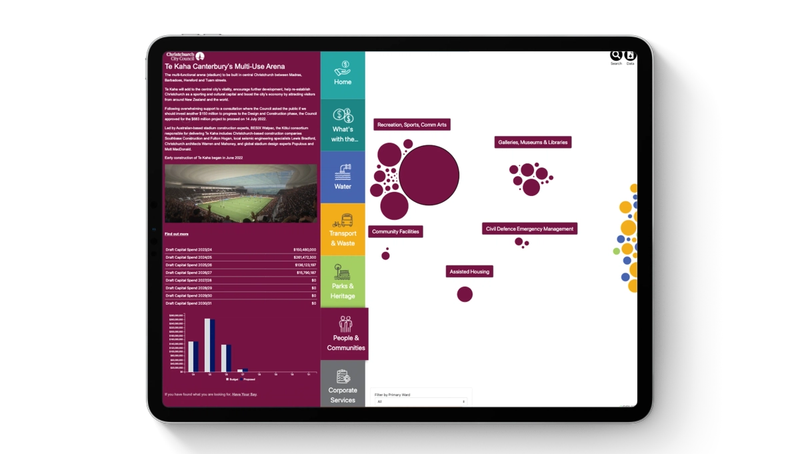
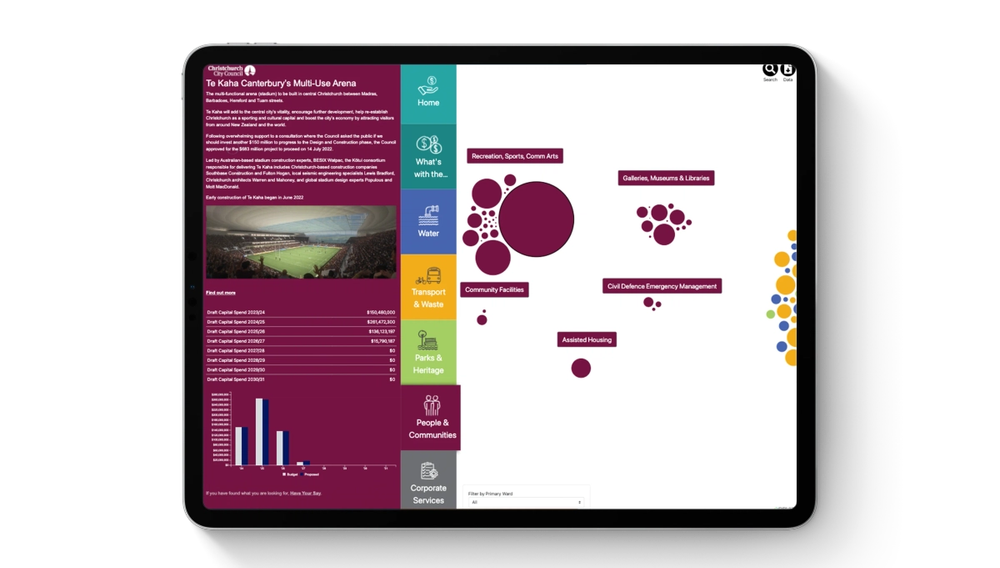
OrbViz Bubbles solved this problem for CCC by taking the same information and putting it into a fun, interactive format. The complex data of CCC’s report became digestible, easy to identify, and created a narrative around the budget plans that community members could understand.
“Our stakeholders could see everything from top level expenditure to finding out when their roads are getting resurfaced, the sewer pipe getting renewed or that local community centre going to be built,” Michael said. “They get a personalised view of the data and can find what’s important to them quickly.”
The power of Bubbles
Creating a strong, visual narrative through the unique features of OrbViz has allowed community members to understand Council budget decisions and resource allocation - and it’s working! OrbViz analytics indicate that users spent an average of 3-and-a-half minutes on the site.
OrbViz Bubbles has enabled CCC to be far more transparent about expenditure and where public money is going.
“Orbviz Bubbles made the information digestible,” Michael said. “Key benefits were the ease of access to the data, the intuitiveness of it and then the speed to insights.”
