Financial Reporting - From line items to narratives
Set, review and get feedback on budgets at lightning speed. Transform hundreds of line items into clever, personalised insights that engage stakeholders and gather feedback.
External budget:
- Build trust with best practice engagement: present an interactive budget that stakeholders can explore and give feedback on
- Frictionless updates in seconds for planned versus actual spend
- Filter by area to find relevant spend
Internal budget:
- Save time by getting your team all on the same (digital) page in a live setting
- Present capital and operational spend by area
- Customisable filters to segment spend, i.e. adjustable/non-adjustable
- Collect feedback, adjust and seamlessly update
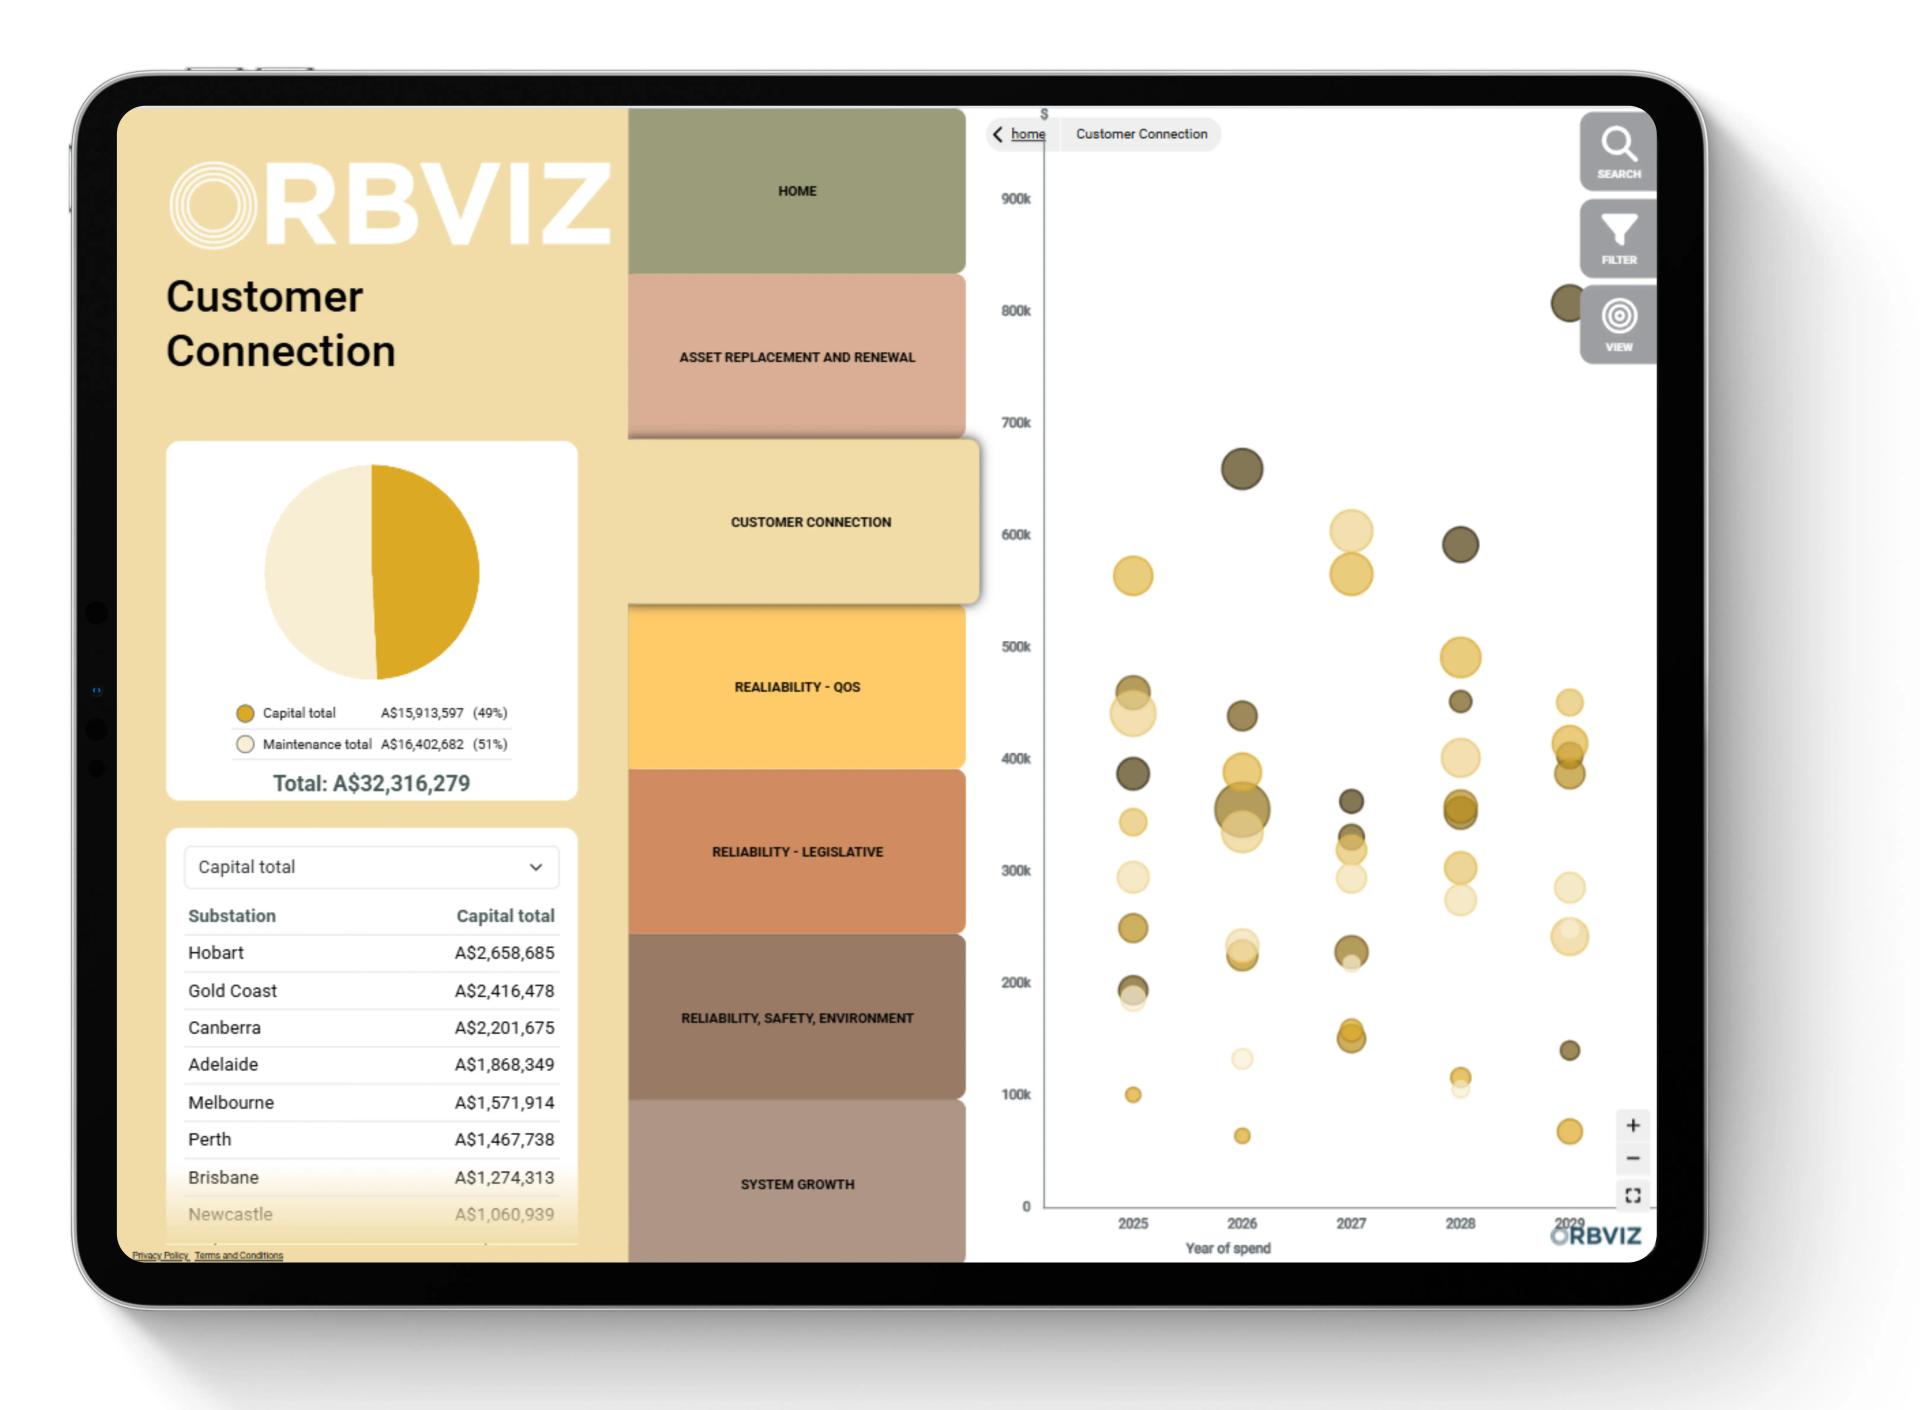
Asset management:
- Single source of truth for capital and maintenance project information
- Display spend over time with XY visualisation
- Customisable filters to select personalised view
- Drag-and-drop update